dimanche 5 décembre 2010

Thai Baht Rises to 13-Year High

Thai Baht Rises to 13-Year High

As I pack my bags and head to Thailand for a vacation (for forex research purposes…yeah right), I thought it would be appropriate to blog about the Thai Baht’s strength. The momentum behind the Baht has been nothing short of incredible, and as often happens in the forex markets, the currency’s rise is becoming self-fulfilling. It has already appreciated 8.5% over the last year en route to a 13-year high, and some analysts predict that this is just the beginning.
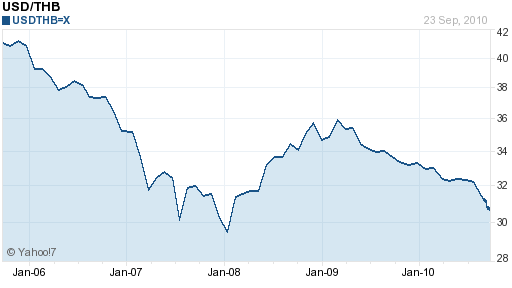
THB USD Baht Dollar Chart 2006-2010
The last time I travelled to Thailand, in 2004, the Baht was trading around 40 USD/THB, compared to the current exchange rate of 30.7. That’s pretty incredible when you consider that during the intervening time, Thailand experienced a military coup and related political instability, as well as a financial crisis that dealt an especially heavy blow to the world’s emerging market currencies. And yet, if you chart the Baht’s performance against the Dollar, you would have only the faintest ideas that either of these crises took place.
To be sure, the financial crisis exacted a heavy toll on Thai financial markets and the Thai economy. Stock and bond prices lurched downward, as foreign investors moved cash into so-called safe haven currencies, such as the US Dollar and Japanese Yen. However, the Thai economy was among the first to emerge from recession, expanding in 2009, and surging in 2010. “Compared with a year earlier, GDP rose 9.1%, while the economy grew 10.6% in the first half,” according to the most recent data. Tourism, one of the country’s pillar industries, has already recovered, along with exports and consumption. Projected export growth of 27% is expected to drive the economy forward at 7-7.5% in 2010, according to both the IMF and Thai government projections. The consensus is that growth would have been even more spectacular (perhaps 1-2% higher) if not for the politcal protests, which were finally quelled in May of this year.
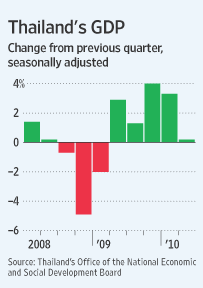
Thailand GDP 2008-2010
Despite concerns about risk and volatility, foreign investors are once again pouring funds in Thailand at a record pace. Over $1.4 Billion has been pumped into the stock market alone in the year-to-date. As a result, “Thailand’s benchmark SET Index has rebounded30 percent since May…helping send the SET to its highest level since November 1996.” Capital inflows are also being spurred by Thai interest rates, which are rising (the benchmark is currently at 1.75%), even while rates in the industrialized world remain flat. At this point, the cash coming into Thailand well exceeds the cash going out, which remains low due to steady imports and restrictions on capital outflows by Thai individuals and institutions. This imbalance is reflected in the Central Bank of Thailand’s forex reserves, which recently topped $150 Billion, more than 50% of GDP.
Anticipation is building that Thailand will use some its reserves to try to halt, or even reverse the appreciation of the Baht. After last week’s intervention by the Bank of Japan, such intervention is now seen not only as being more acceptable, but also more necessary. Due to pressure from the Prime Minister, the Central Bank has convened at least one emergency meeting to determine the best course of action. So far, members can only agree that restrictions on capital flows and lending standards to exporters should be relaxed.
For what it’s worth, Thailand’s richest man has urged the Central Bank not to act: “The effort is likely fruitless as foreign capital is expected to incessantly flood into Thailand because of the country’s healthy economic recovery and export growth. The baht as a matter of fact should become even stronger should Thailand’s politics remain in normal condition.” He is supported by the facts, which show that the Thai export sector has held up just fine in the face of the rising Baht, though perhaps only because other Asian currencies have risen at a comparable pace.
If other Central Banks were to step up their intervention – (Deutsche Bank has argued, via the chart below, that all “Asian central banks have for many years been more or less persistently in the market “stabilizing” their currencies, but with a clear bias towards preventing USD depreciation in this region”) – the Bank of Thailand would probably have no choice but to follow suit.
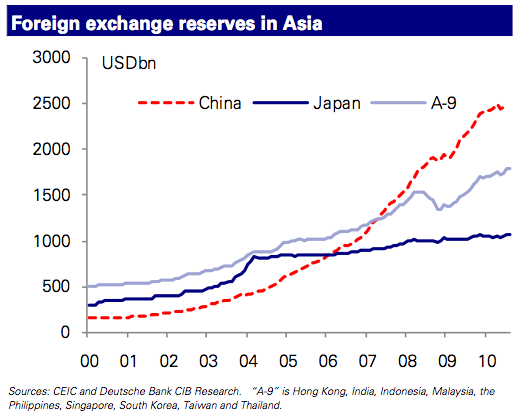
Foreign Exchange Reserves, Central Bank Intervention in Asia 2000-2010
Otherwise, it might not be long before the Baht clears 30 USD/THB. My next post on the Baht, in 2015, will probably be in the form of a similar lamentation…

Periphery Yield Spreads Provide EUR Resistance

The market remains fearful of the BOJ, last nights actions prove that. Yen free-falls on rumors that BOJ Governor Shirakawa was resigning his post, later denied and fear that instability at the BOJ was not a good thing for the financial markets clearly favored the yen by this morning. Again another wild ride, similar to the EUR’s advance after the surprising German ifo business climate index (106.8) this morning to its highest level in more than 3-years. Supposedly, German companies can ‘weather weaker demand from abroad as the global economic recovery slows’. The widening PIIGS yield spread to the Bund should again provide resistance for the EUR.
The US$ is mixed in the O/N trading session. Currently it is higher against 10 of the 16 most actively traded currencies in a ‘volatile’ trading range.
Forex heatmap
Yesterdays weekly US claims report brought no joy to the market. The headline print (+465k vs. +453k) interrupted the month long downward trend that analysts note ‘unfortunately occurs at the tail end of the NFP reference period covering the first half of the month’. Continuing claims fell by -48k to +4.489m (a second consecutive weeks decline), straddling the summer long +4.5m print as claims push further into extended and emergency categories. The number of individuals receiving extended and emergency benefits increased +94.1k to +950k and +114k to +4.2m respectively. This has reversed some of the previous week’s declines. Other data was somewhat more upbeat. US leading indicators rose last month more than expected (+0.3% vs. +0.1%), signaling the economy will keep expanding through early next year. Digging deeper, the increase was due to a longer factory workweek, higher stock prices and a gain in building permits. Seven of the 10 sub-categories contributed to the gain while three components weighed on the index, rising jobless claims, a drop in manufacturing supplier deliveries and manufacturers’ orders for consumer goods. Even sales of existing home sales surpassed market expectations (+4.13m vs. +3.84m) and rose from their record lows. However, they are still close to record lows and suggest that the housing market remains depressed one year after economic recovery began. To date, the market has relatively low expectations of housing print headlines due to the glut of inventory, the number or mortgages, high unemployment levels and any one of these variables will take its time to work through the system. The median sales price advanced +0.8% to $179k. Previously owned homes fell -0.6% to +3.98m and at this sales pace, it would take 11.6-months to sell those houses, compared with 12.5m the previous month.
The USD$ is lower against the EUR +0.46%, CHF +0.28% and higher against GBP -0.42% and JPY -0.22%. The commodity currencies are stronger, CAD +0.21% and AUD +0.60%. The loonie continues to trade under pressure as risk aversion strategies dominate. With investors shunning higher yielding assets has pushed the dollar to print a three weeks high yesterday. With retail sales falling more than expected in July and a decelerating inflation print has had the CAD on the back foot this week paring almost 1% of its value. It has been the worst performing of all the major currencies vs. the USD. Mixed US data has dealers reducing their bets that Governor Carney will be raising rates any time soon. The market is beginning to question the ‘true’ strength of the Canadian Economy after the last few data releases coming in much softer than expected. Most of the loonies fall from grace can be attributed to weaker oil prices that are underperforming after the unexpected weekly EIA report earlier in the week. To date the US/CAD spread has dominated he directional play of North American currencies. Month-to-date, spread trades have been the most fundamentally, macro-financial driven reason to want to own the loonie vs. its southern neighbor. A wider spread ‘reflects the improved monetary policy sentiment for Canada’ and is supportive for the currency. With the BOC possibly stepping to the sidelines next month has speculators unwinding some of the CAD long trades in front of the decision. Depending on what commodities are doing, dollar buyers remain on the bid all the way down in the short term.
For a sixth consecutive week the AUD is on top backed by its yield advantage over most of it major trading partners. The spread between 2-year Australian bonds and its US counterpart is near the largest in two years (+442bp). The currency has retreated from its highs as regional bourses see red and profit taking took place. There is a strong difference in monetary policy stance between Australia and the US and it should eventually provide stronger support for the Aussie. Australia is benefiting from its unilateral trade links with the Chinese economy, its largest trade partner. Not helping the currency will be the forming of a minority government. PM Gillard won the backing of key independent lawmakers this month, allowing her Labor Party to retain government and pursue a ‘tax on mining companies’. Technically, ‘the fiscal outlook looks worse under a minority government and management of an economy growing at +10% in nominal-terms may increasingly rest on the RBA’. The problem, a proposed tax on mining companies will dampen demand for the nation’s assets. If we happen to witness global economic growth decelerating, then we could have the reallocation of funds back out of growth currencies just as quickly as it came in. Until recently, the AUD has gained ground against all of its major trading partners as the ‘vix index’ of volatility softens, boosting investor appetite for assets tied to growth. ‘Clearly what happens in the Australian economy is now more dependent upon what happens in China’. Investors are better buyers on deeper pullbacks (0.9545).
Crude is higher in the O/N session ($75.30 +12c). Crude prices ended yesterday under pressure after a surprising weekly EIA report, global bourses seeing red and as the dollar recovered from its weakest level vs. the EUR. Analysts believe that the higher inventories, coupled with the lack of any significant weather patterns in the Gulf of Mexico, are likely to send crude prices lower in the short term. Crude supplies rose +970k barrels to +358.3m. The market had been expecting a shortfall of -1.75m barrels. A weaker dollar generally broadens the investment appeal of commodities. Stocks of gas and distillates (heating oil and diesel) also increased unexpectedly. Gas inventories rose by +1.6m barrels, while distillates rose by +300k barrels. Higher inventory supplies have been the biggest inhibitor for a market advance over the past quarter as stockpiles of oil have recorded the highest levels in 27-years. Hence the divergence somewhat of oil and equity markets of late. The market is wary that the underlying situation has not changed, the overall fundamentals remain weak. Analysts expect speculators to remain better sellers on up-ticks in the short term despite the weakness of the dollar.
Gold has stood tall and ending the week on its highs. Collectively this week it has recorded five record highs and does not seem to in danger of breaking that trend. A concern about a weaker dollar coupled with the sustainable growth issues of the US economy has investors seeking protection in an asset with a ‘store of value’. Any mentioning of projects to keep the currency low will provide stronger support for the commodity. Year-to-date, the yellow metal has appreciated +18.9%, outperforming most of the other asset classes, as global sovereign-debt concerns and an ‘uneven economic recovery roil financial markets’. With the dollar currently trading at new lows vs. the EUR is also aiding commodity prices. Metals are heading for their 10th consecutive annual gain. Global ‘fear’ has the momentum, again, to push speculators back into this overcrowded, one-directional commodity trade. With the Fed on the verge of implementing further QE programs ‘tend to be supportive of asset prices and is fueling concerns about the potential longer-term inflationary affect of such measures’. The opportunity costs of holding gold are low due to falling interest rates, by default, the market should expect better buying of the metal on pull backs ($1,298 +$2.20c).
The Nikkei closed at 9,471 down -95. The DAX index in Europe was at 6,172 down -13; the FTSE (UK) currently is 5,538 -9. The early call for the open of key US indices is higher. The US 10-year backed up 3bp yesterday (2.55%) and is little changed in the O/N session. This week yields have tumbled across the curve especially in the short end. Ten-year product temporarily traded through 2.5% yesterday and two-year product managed to print a record low return after the Fed’s statement earlier in the week. Policy makers are willing to ease monetary policy to try to boost the US economy and employment. The curve has flattened to its narrowest point in two-weeks (+211bp). Further risk of economic relapse is providing the bid for debt despite the mixed data from claims and existing home sales yesterday. The market can expect treasuries to trade within a tight range short term.
Forex Technical Analysis for Week 09/27—10/01

EUR/USD trend: buy.
GBP/USD trend: buy.
USD/JPY trend: sell.
EUR/JPY trend: sell.
GBP/JPY trend: sell.
Floor Pivot Points
Pair 3rd Sup 2nd Sup 1st Sup Pivot 1st Res 2nd Res 3rd Res
EUR/USD 1.2718 1.2873 1.3182 1.3337 1.3646 1.3801 1.4110
GBP/USD 1.5266 1.5385 1.5605 1.5724 1.5944 1.6063 1.6283
USD/JPY 81.97 83.05 83.65 84.73 85.33 86.41 87.01
EUR/JPY 109.87 110.66 112.17 112.96 114.47 115.26 116.77
GBP/JPY 129.18 130.44 131.90 133.16 134.62 135.88 137.34
Woodie’s Pivot Points
Pair 2nd Sup 1st Sup Pivot 1st Res 2nd Res
EUR/USD 1.2912 1.3258 1.3376 1.3722 1.3840
GBP/USD 1.5410 1.5657 1.5749 1.5996 1.6088
USD/JPY 82.93 83.42 84.61 85.10 86.29
EUR/JPY 110.84 112.52 113.14 114.82 115.44
GBP/JPY 130.49 131.99 133.21 134.71 135.93
Camarilla Pivot Points
Pair 4th Sup 3rd Sup 2nd Sup 1st Sup 1st Res 2nd Res 3rd Res 4th Res
EUR/USD 1.3235 1.3362 1.3405 1.3447 1.3533 1.3575 1.3618 1.3745
GBP/USD 1.5640 1.5733 1.5764 1.5795 1.5857 1.5888 1.5919 1.6012
USD/JPY 83.34 83.80 83.95 84.11 84.41 84.57 84.72 85.18
EUR/JPY 112.41 113.04 113.25 113.46 113.88 114.09 114.30 114.94
GBP/JPY 131.85 132.60 132.85 133.10 133.60 133.85 134.10 134.85
Fibonacci Retracement Levels
Pairs EUR/USD GBP/USD USD/JPY EUR/JPY GBP/JPY
100.0% 1.3493 1.5842 85.80 113.76 134.43
61.8% 1.3316 1.5713 85.16 112.88 133.39
50.0% 1.3261 1.5673 84.96 112.61 133.07
38.2% 1.3206 1.5632 84.76 112.34 132.75
23.6% 1.3139 1.5583 84.52 112.00 132.35
0.0% 1.3029 1.5503 84.12 111.46 131.71

Japan Does It Again!

Earlier this morning, the Bank of Japan again intervened in the currency, selling Yen which caused it to weaken. As I mentioned yesterday, the market may have been trying to test the BOJ as most of the country is away from business on holiday.
In the Euro zone, German business confidence came in better than expected for the current assessment, but slightly lower for the future outlook.
In the US, durable goods orders came in lower than expected on the headline number, showing a decline of 1.3% vs. an expected decline of 1%. However stripping out transportation, the figure rose to 2% vs. an expectation of a 1% gain, providing a silver lining. Later this morning, new home sales will be out which are expected to be higher than last month.
So this morning there is noticeable risk appetite in the market as European stocks and US equity futures are higher, highlighted by Dollar and Yen weakness due to the BOJ intervention.
Earlier, gold reached $1300 as it has been trading more like a safe haven currency than a physical commodity.
In the forex market:
Aussie (AUD): The Aussie is higher this morning as the Bank of Japan is practically begging investors to put on carry trades and in the process weaken Yen. OK BOJ, if you say so!
Kiwi (NZD): The Kiwi is higher as well for the same the reasons as Aussie, though gains are slightly less after the recent GDP reports which did not meet expectations.
Loonie (CAD): The Loonie is actually the largest gainer this morning as oil prices have rebounded to 75.75 and Yen intervention is stoking fears that the US Fed may act to weaken the US dollar further through quantitative easing. (Click chart to enlarge)
usdcad0924.JPG
Euro (EUR): The Euro is up this morning on German business confidence figures which reached a 3-year high, as well as French GDP figures and Italian retail sales figures that came in slightly higher than expected. The Euro stands to benefit further should the US dollar continue to be weak, and as long as the debt crisis remains under control. (Click chart to enlarge)
eurusd0924.JPG
Pound (GBP): The Pound is also higher as money flows are making their way out of the Dollar and Yen. There is no other economic data for the UK today so expect it to trade as a greenback alternative.
Dollar (USD): The Dollar is weaker as the Durable Goods Data was seen as largely positive, further encouraging the risk-taking that got started by the Bank of Japan. New Home Sales are due out later this morning and the market is expecting an increase from last month’s dismal numbers.
Yen (JPY): The Yen was weaker this morning on BOJ intervention despite being on holiday, although government officials would not confirm that’s what took place. However, all of the gains have been given back and one must wonder how much more selling the BOJ is willing to do. (Click chart to enlarge)
usdjpy0924.JPG
The Bank of Japan and the US want you to earn more interest! Just don’t go looking for it in either of their respective banking systems. The way to earn that interest is to sell both Dollar and Yen and buy higher yielding currencies like the Aussie, the Kiwi, the Rand, and even some of the exotic currencies in emerging markets.
Just whatever you don’t buy Dollars or Yen! Suspend your disbelief that the global economy is sound and that global risk is non-existent. Use gold and the Swiss franc as a risk proxy as both the US and Japan are about to speed up the race to the bottom.
There are many more attractive economies around the globe right now and diversifying into some of them and being compensated to do so is a win-win for investors.
If you are not taking advantage of the global currency market and the fact that both the US and Japan are practically BEGGING you to sell their currencies, then your future as an investor may be limited!
To learn more about how you can take advantage of world events through the currency market, be sure to check out our currency trading courses!
To follow these events live with a free, real-time practice account, click here! Don’t miss out on the world’s fastest growing market!

Canadian Dollar Reaches Parity…Again

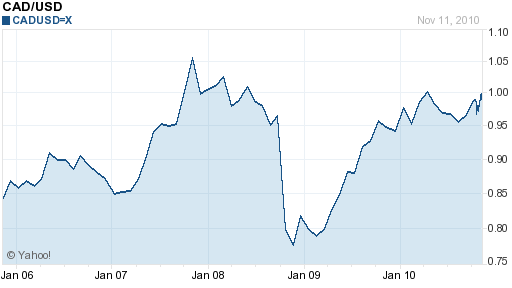
Last week, the Canadian Dollar became the second currency – after the Australian Dollar – to reach parity against the US Dollar. While the case for Loonie parity is not quite as strong as the Aussie’s, there is nonetheless reason to believe that it will continue trading at this level for the short-term.
CAD USD 5 Year Chart
It’s not hard to understand what’s driving the Loonie; the weak Dollar. As the Fed embarks on further monetary easing (QE2), investors are nervous that all of these new Dollars will be deployed in a speculative – rather than productive capacity. Emerging market currencies are particularly popular, with commodity currencies, such as the Canadian Dollar, not far behind.
According to Bank of Canada Governor Mark Carney, “The outlook for the Canadian dollar… ultimately reflects the economic fundamentals.” While he has threatened to intervene if currency markets are “disrupted” (i.e. if the Loonie rises to an unreasonable level), past history and the tone of Carney’s remarks suggests that the Bank of Canada will remain on the sidelines for the duration of the currency war.
From where I’m sitting, the Canadian Dollar (as with the New Zealand Dollar, the subject of my previous post), don’t deserve to benefit from the speculative wall of money that is flowing out of the US. The Canadian economy is projected to grow by only 1% in 2010, and after adjusting for the contraction in 2009, it is still the same size as it two years ago. Not to mention that the Canadian government issued a record amount of debt to shepherd the economy through the recession.
Most worrying is that Canada’s trade deficit is nearing a record high, and on an annualized basis is now approaching $30 Billion a year. In addition, anecdotal stories suggest that Canadians are engaging in cross-border shopping and traveling abroad in great numbers to take advantage of relatively cheap prices. With the Canadian Dollar now at parity, these phen0omena are already becoming entrenched: “We would not anticipate much of an improvement in these trade patterns in the next couple of quarters,” said one economist.
Canada Balance of Trade
There are two observations that can be made here. First of all, while Canada is certainly a natural resource economy, the boom in commodity prices really isn’t helping Canada in the same way that it is helping Australia, for example. That’s mainly because Canada’s principal market for commodity exports is the US, which remains weak. In contrast, the booming economies of China and Greater Asia ensure an expansive and growing market for Australian natural resources. Moreover, as evidenced by a growing trade deficit, exports of commodities are being offset by an increase in imports: “Economists at Bank of Montreal and Desjardins Financial say weak trade will carve as much as three percentage points from GDP growth in the third quarter.”
The second observation is that currency markets are self-correcting, and that is especially true in the case of the Canada. As the Loonie rises, Canadian exports become less competitive, and consumers (sometimes physically!) start importing more. At some point then, the Loonie will reverse its decline, and the trade deficit will shrink.
However, if you drill deeper into the numbers, you can see that Canada is running a sizable trade surplus with the US. That means that the Canadian Dollar probably has room to rise further (or the Dollar has room to fall further), before the bilateral trade deficit would even close to narrowing. On a trade-weighted basis (perhaps against the Euro), the Loonie has few sources of fundamental support. For what it’s worth, analysts from CIBC World Markets seem to agree: they see the Loonie declining more than 5% over the next six months as the uproar over QE2 gradually fades, and the data shows that only a modicum of the newly printed US Dollars found their way into Canada.

How Analyzing Forex with Elliott Wave Can Help You Catch Both Rallies and Declines

By Elliott Wave International
On November 1, the EUR/USD — the euro-dollar exchange rate and the most actively-traded forex pair — was trading the $1.38 range, near the level it is today.
But if you look at what the EUR/USD did between November 1 and 9, you’ll see a huge 400-point (or pip, in forex lingo) rally into the November 4 top — and an equally huge decline back to the levels we see today.

That’s an 800-pip "round trip" in just six trading days — a huge move which obviously caught a lot of the U.S. dollar bears and bulls by surprise. Could you have seen it coming?
If you know how to analyze currencies with Elliott wave, the answer is probably "yes." Wave analysis helps you identify patterns in market charts and tells you how those patterns — ideally — should develop. In other words, Elliott allows you to narrow down multiple possibilities to a handful of probabilities.
A probability is never a certainty. But it’s better than a shot in the dark, as this example demonstrates.
On November 1, Elliott Wave International’s Currency Specialty Service posted the following end-of-day forecast. (Some Elliott wave labels removed for this article):
Currency Specialty Service
[Higher, into a top] The euro is poised to thrust above 1.4160. The question is if the thrust takes place before the FOMC announcement and ends afterward, or starts in response to the announcement. Before or after, the euro should hit new highs.
What gave Currency Specialty Service the confidence to make that forecast? It was the "contracting triangle" pattern you see in the chart above. They often appear in 4th waves, right before the market’s final push in wave 5. The EUR fulfilled the forecast with a 400-pip rally into the November 4 top. The following day, our Currency Specialty Service wrote:
The euro is reversing course after a thrust from a triangle. The decline from 1.4283 might not be in five waves, but it has the characteristics of an impulsive wave. A correction of the rally from August should reach the 1.3636-1.3700 area, the 38.2% retracement of the advance…
…which brings us to the price levels where we find the EUR/USD today. And if you’re curious to know what Currency Specialty Service has to say now, you have a great opportunity:
FreeWeek is live through noon EST on Thursday, November 18! You can access all the intraday, daily, weekly and monthly forecasts from EWI’s Currency Specialty Service right now through noon Eastern time Thursday, Nov. 18. This service is valued at $494/month, but you can get it free! Click here to access Currency Specialty Service FreeWeek.
This article was syndicated by Elliott Wave International and was originally published under the headline How Analyzing Forex with Elliott Wave Can Help You Catch Both Rallies and Declines. EWI is the world’s largest market forecasting firm. Its staff of full-time analysts led by Chartered Market Technician Robert Prechter provides 24-hour-a-day market analysis to institutional and private investors around the world.

samedi 4 décembre 2010

Echanger sans trace - projet Master Marketing

Voici un moment que la Fing a lancé ce thème d’étude. S’il a dans son intitulé la saveur d’un puzzle, de goût de l’énigme, il a en fait la force d’une évidence et le vertige de la naïveté. Ainsi donc, dans l’espace numérique, il ne serait plus vraiment possible de commercer comme on commerce au marché, dans la rue, et chez les boutiquiers.

Juste se promener, fouiner, dénicher et acheter en payant en billet gras ou craquant un meuble, une tomate, un tube de dentifrice, ou juste une mise en pli, sans avoir à donner son nom, son adresse ou le moins autre signe, ne laisser qu’un sourire et partir faire d’autres affaires, sans trace, sans mémoire, l’affaire dénouée et le contrat rempli. Dans la vie ordinaire les commerçants ne font pas remplir de fiche, ne copient pas nos papiers d’identités, ils s’assurent juste par quelques questions de la particularité de nos goûts, et usent de leur intelligence pour nous offrir ce que nous voulons. Et nous en sommes heureux le plus souvent, il ne faut guère que quelques minutes, un bref échange, pour que nous ayons le sentiment d’avoir obtenu ce que nous désirions.

Et bien dans l’univers digital c’est une chose bien difficile à obtenir. Avant même d’avoir goûté le moindre fruit il faut laisser son pédigrée, et quand nous payons ce n’est pas qu’une somme que nous abandonnons mais toute une histoire financière. Voudrions-nous rester des anonymes, c’est un chemin de croix qui se présente à nos pas. Le simple fait d’un billet posé sur le comptoir devient une acrobatie technique et commerciale inouïe dans l’espace digital. Les solutions existent. L’une d’elles que les sites porno ont mise au point est un paiement par tiers, l’opérateur téléphonique qui nous accorde un code, en fonction d’un débit. PayPal est sur les rangs aussi.

Mais le problème ne se limite pas au paiement, la recherche d’information aussi peut faire l’objet d’une personnalisation sans nécessaire identification. Les techniques de filtrage collaboratif, certains jeux de rôles, des interviews diagnostics, les techniques ne manquent pas pour offrir au consommateur l’information qu’il souhaite sans qu’il doive se déclarer. Après tout, le succès de Google s’appuie sur ce principe très général, supposant au passage que la pertinence n’est pas si subjective !

C’est ce sujet d’étude qu’un groupe d’étudiant du Master Marketing Opérationnel et International explore, en cherchant dans l’espace des sites Web, qu’ils soient marchands ou non, des cas remarquables, afin d’établir une typologie des méthodes et des techniques, en collaboration avec un groupe de travail du projet Identités Actives de la Fing.

Technologie du marketing : les nouvelles frontières de la relation

On ne le répètera sans doute jamais assez, le marketing est de plus en plus technologique. Une enquête du JDN en donne de sérieuses indications, et l'EBG annonce une croissance de 54% !

Voilà qui sans remettre en question l'approche relationnelle du marketing, soulève des enjeux importants. C'est à ces enjeux que le groupe de recherche "technologies du marketing" s'intéresse, associant à sa réflexion les étudiants du Master Marketing Opérationnel International qui en auront exploré quelques-uns. Pour 2008/2009, cinq projets principaux ont été développés et leurs résultats sont présentés le 2 avril 2009, à l'occasion d'une conférence donnée dans le cadre de la remise de diplômes aux promotions précédentes, et présidée par Emmanuel Mignot, PDG de Teletech :

*
Un premier projet s'attache à faire un bilan de la manière dont les praticiens conçoivent la relation client après la vague du 2.0, en s'appuyant sur les entretiens collectés et produits par CherClient .
*
Un second explore avec Netvibes l'intérêt des techniques de lien RSS pour construire un instrument de veille pour les marques.
*
Le troisième s'intéresse aux nouveaux canaux de e-publicité : une analyse par l'usage des smartphones.
*
Le quatrième, dans le cadre d'une collaboration avec le Baromètre de l'intrusion développé par Yann Claeyssen d'ETO, est une enquête qualitative sur la perceptions de "l'intrusivité" du marketing ( Partenaire : ETO).
*
Le cinquième s'intéresse à comment Personnaliser sans Identifier (Avec le groupe Identités Actives de la Fing)